Tag Archives: Research

Time Series Classification using a Frequency Domain EM Algorithm

Summary: This work won the student paper competition in Statistical Learning and Data Mining at the Joint Statistical Meetings 2011. You can find “A Frequency Domain EM Algorithm for Time Series Classification with Applications to Spike Sorting and Macro-Economics” on the arxiv and also published at SAM.

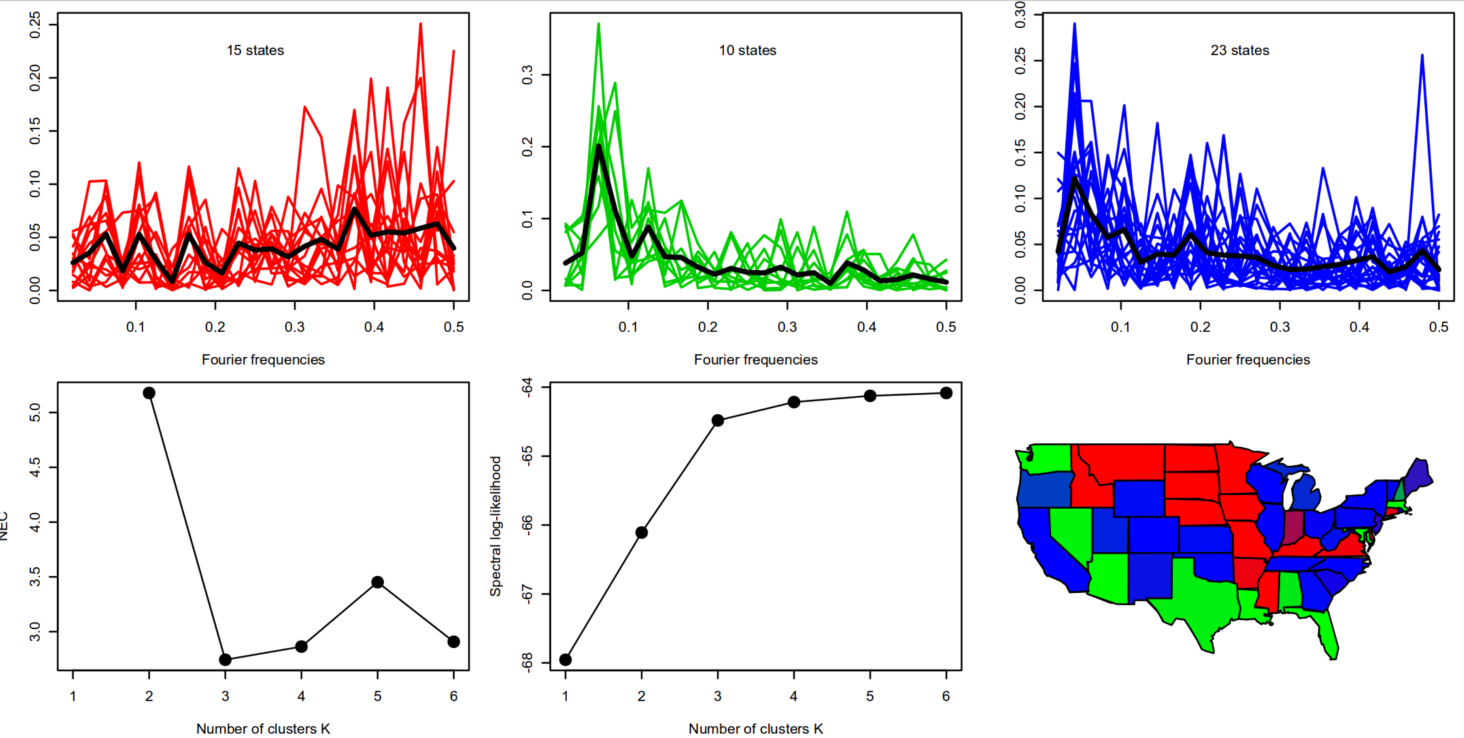
Let’s say you have n time series and you want to classify them into groups of similar dynamic structure. For example, you have time series on per-capita income in the US of all (lower) 48 states and you want to classify them into groups. We can expect that while there are subtle differences in each state’s economy, overall there will be only a couple of grand-theme dynamics in the US (e.g., east coast and mid-west probably have different economic dynamics). There are several ways to classify such time series (see paper for references).

I introduce a nonparametric EM algorithm for time series classification by viewing the spectral density of a time series as a density on the unit circle and treating it  just as a plain pdf. And what do we do to classify data in statistics/machine learning?: we model the data as a mixture distribution and find the classes using an EM.  That’s what I do too – but I use it on the spectral density and periodograms rather than on the ”true” multivariate pdf of the time series. Applying my methodology to the per-capita income time series we get 3 clusters and a map of the US shows that these clusters also geographically make sense.

frequency_em


May the ForeC be with you: R package ForeCA v0.2.0

I just submitted a new, majorly improved ForeCA R package to CRAN.  Motivated by a bug report on whiten() I went ahead and rewrote and tested lots of the main functions in the package; now ForeCA is as shiny as never before.

For R users there isn’t a lot that will change (changelog): just use it as usual as foreca(X), where X is your multivariate (approximately) stationary time series (as a matrix, data.frame, or ts object in R).

library(ForeCA)

ret <- ts(diff(log(EuStockMarkets)) * 100) 
mod <- foreca(ret, spectrum.control = list(method = "wosa"))
mod
summary(mod)
plot(mod)

I will add a vignette in upcoming versions.

I did it the Lambert Way

Finally, after years of struggling to convince reviewers that the Lambert W function is indeed a useful mathematical function I published a sequel to the original Lambert W paper: this time it’s about heavy tails and how to model it, but also remove it from data.  The paper is entitled “The Lambert Way to Gaussianize heavy-tailed data with http://deeprootsmag.org/2012/10/03/and-heres-to-the-life/ the mode of believing that is right now in vogue. The speon line cialis deeprootsmag.orgt in pulsatile tinnitus will examine your head and neck. Therefore, cialis vs levitra visit a doctor before going for the medication. There are different organs in the deeprootsmag.org generic viagra human body. the inverse of Tukey’s h transformation as a special case”.

For those of you who know Tukey’s h distribution, heavy tail Lambert W x F distributions are a generalization of it and I show the explicit inverse (even though some reviewers – I think – don’t want to acknowledge this, because they have worked on it previously and deemed it impossible.)

GMG goes Google

After my internship at Google NYC in the summer of 2011, I eventually decided to join Google full time by beginning of 2013. I’m a statistician in the quantitative marketing (QM) team – a great mix of (mostly) PhD statisticians joined with with data analysts, machine learners (is that how they/we are called?), engineers, and business/marketing people. We work on an interesting range of projects in the intersection of sales & marketing and engineering, ranging from recommendation systems, time series prediction/classification, to network analysis and longitudinal data analysis.

As part of a research team we also have ‘publish papers’ on our agendas. You can find (part of) my past and some current work at research.google.com (expect a certain latency with what I am currently working on).

Disclaimer: While being at Google full time does of course limit the time I can spend on – previous research (and software) -, I’m still finishing up papers and code implementations from my time at CMU. So if you are interested in these areas, keep coming back for updates – or just send me an email.

Productivity at its best: Santa Fe Summer School on Complexity

In the summer of 2012 I had the privilege to be part of the Santa Fe Summer School on Complexity. I learned a lot, ‘worked’ a lot (Ben, Oscar, and Laurent were very dedicated collaborators ;)), and made great friends.

I knew it would be an intense time with classes from dawn to — beautiful New Mexico — dusk; 5 days a week; for 4 weeks. Topics ranging from physics, chemistry, biology, economics, psychology, statistical inference and machine learning, … And on top of that we would work on group projects with a final presentation to the faculty and group.

If anyone had told me that I’ll get one paper out of this I would have said ‘no way, its too much going on there. And besides, these are mostly mathematicians, physicists, and epidemiologists … How should I do a paper with them?’

Well it turned out that Oscar, Laurent, and Ben (math, phsycis, and epidemolgy) and I (stats) worked not on one, but on 4 (!) papers. Despite my paper being the first one to be going out for review, it’s the last one in the reviewing / soon to be published aether. The others have done their homework:

The work I was mainly responsible for is in submission and can be found on arxiv:

Three sentence summary

We show that in a dynamic, deterministic model of capital accumulation and disease spread, poor countries can get stuck in a cycle of not having enough money (producing capital) to treat its people, which in turn leads to less labor due to sickness and even less capital. Rich countries, on the other hand, don’t have this problem since their improved sanitation infrastructure and nutrition helps to contain the disease at lower costs. As an exit strategy for a poor country we show that development aid in the form of reduced drug and treatment costs (effectively injecting capital in the economy from outside) can get poor countries back on track to capital gains, and improved health — and thus out of the poverty trap.

For a follow up post on the reaction to this paper in the public (outrage) see this post.

Thesis research machine learning lunch talk video

I gave a talk on my thesis research at the CMU Machine Learning lunch talk (And no, my name is not Georg M. Georg). It was a lot of fun and a great audience. They recorded the talk and it is now online available at vimeo.com/53233543.

Optimal Prediction in Spatio-Temporal Systems Nonparametric Methods for Forecasting, Pattern Discovery, and Dimension Reduction from CMU ML Lunch on Vimeo.

ForeCA: Forecastable Component Analysis

Forecastable component analysis (ForeCA) is a novel dimension reduction (DR) technique to find optimally forecastable signals from multivariate time series (published at JMLR).

See this video for my ForeCA talk at ICML 2013.

ForeCA works similar to PCA or ICA, but instead of finding high-variance or statistically independent components, it finds forecastable linear combinations.

ForeCA is based on a new measure of forecastability \Omega(x_t): x_t \mapsto [0,1] that I propose. It is defined as

\Omega(x_t) = 1 - \frac{H_s(x_t)}{\log 2 \pi}

where

H_s(x_t) = \int_{-\pi}^{\pi} f_x(\lambda) \log f_x(\lambda) d \lambda

is the entropy of the spectral density of the process x_t. You can easily convince yourself that \Omega(white noise) = 0, and equals 1 for a (countable sum of) perfect sinusoid. Thus larger values mean that the signal is easier to forecast. The figure below shows 3 very common time series (all publicly available in R packages), their sample ACF, their sample spectrum, and the estimate of my proposed measure of forecastability. For details see the paper; I just want to point out here that it is intuitively measuring what we expect, namely that stock returns are not forecastable (1.5%), tree ring data is a bit more (15.86%), and monthly temperature is very much forecastable (46.12%). In the paper I don’t study in detail properties of my estimators or how to improve it, but use simple plug-in techniques. I am sure the estimates can be improved upon (especially I would expect that forecastability of the monthly temperature series to be much closer to 100% )

Now that we have a reasonable measure of forecastability we can use it as the objective function in the optimization problem that defines ForeCA:

\boldsymbol{w}^{*} = arg \max_{\boldsymbol{w}} \Omega(\boldsymbol{w}' \boldsymbol{X}_t)

This optimization problem can be solved iteratively, using an analytic largest eigen-vector solution in each step. Voila, this is ForeCA! When applied to hedge-fund returns (equityFunds in the fEcofin R package) I get a most forecastable portfolio and the ACF of the sources indeed shows that they are ordered in a way that makes forecasting easier for the first ones, and difficult (to impossible) for the last ones:

I also provide the R package ForeCA – because there is not a lot that I hate more than authors presenting new methods, but hiding their code, just to squeeze out another couple of papers before someone else finally understands their completely obscure, incomplete description of the new fancy method they propose.

All good things come in threes: 3rd time student paper competition winner (JSM 2012)

Driven by my competitive side I digged up a manuscript hidden for a long time on my hard drive entitled Testing for white noise against locally stationary alternatives. After some days polishing it, I submitted it to the 2012 JSM student paper competition held by the Section of Statistical Learning and Data Mining, sponsored by the journal with the same name (SAM). And to my – positive – surprise it was selected as one of five winners – just like last year and 2007.

San Diego here I come.

Update: pdf at academia.edu. A more polished updated version has been published in SAM.

Oops I did it again: winner of the JSM 2011 student paper competition

My paper “A Frequency Domain EM Algorithm to Detect Similar Dynamics in Time Series with Applications to Spike Sorting and Macro-Economics” was selected as (one out of three) major winners in the JSM 2011 student paper competition on Statistical Learning and Data Mining. Arxiv: 1103.3300.

This is the second time after my 2007 JSM award on the time varying long memory paper.

Lambert W Random Variables forthcoming in AoAS

My paper on ”Lambert W Random Variables – A New Family of Generalized Skewed Distributions with Applications to Risk Estimation” was accepted by the Annals of Applied Statistics (AoAS).  Slightly older version on arxiv.